Use the plugin
Dashboards management
The StackLight Elasticsearch-Kibana plugin contains two built-in dashboards:
- The Logs Analytics Dashboard that is used to visualize and search the logs.
- The Notifications Analytics Dashboard that is used to visualize and search the OpenStack notifications if you enabled the feature in the Collector settings.
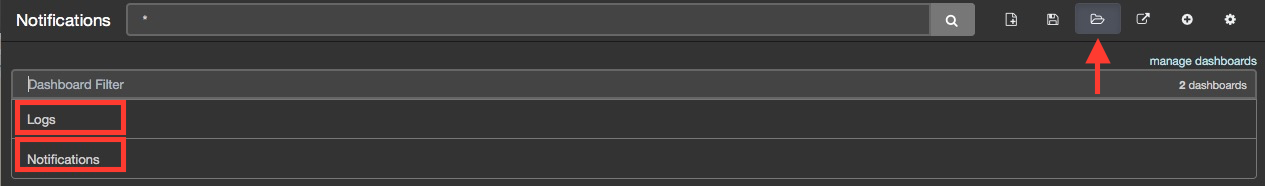
You can switch from one dashboard to another by clicking on the top-right Load icon on the toolbar to select the requested dashboard from the list, as shown below:
Each dashboard provides a single pane of glass for visualizing and searching all the logs and the notifications of your OpenStack environment.
In the Collector settings, you can tag the logs by an environment name to distinguish which logs (and notifications) belong to what environment.
The Kibana Dashboard for logs is divided into several sections.
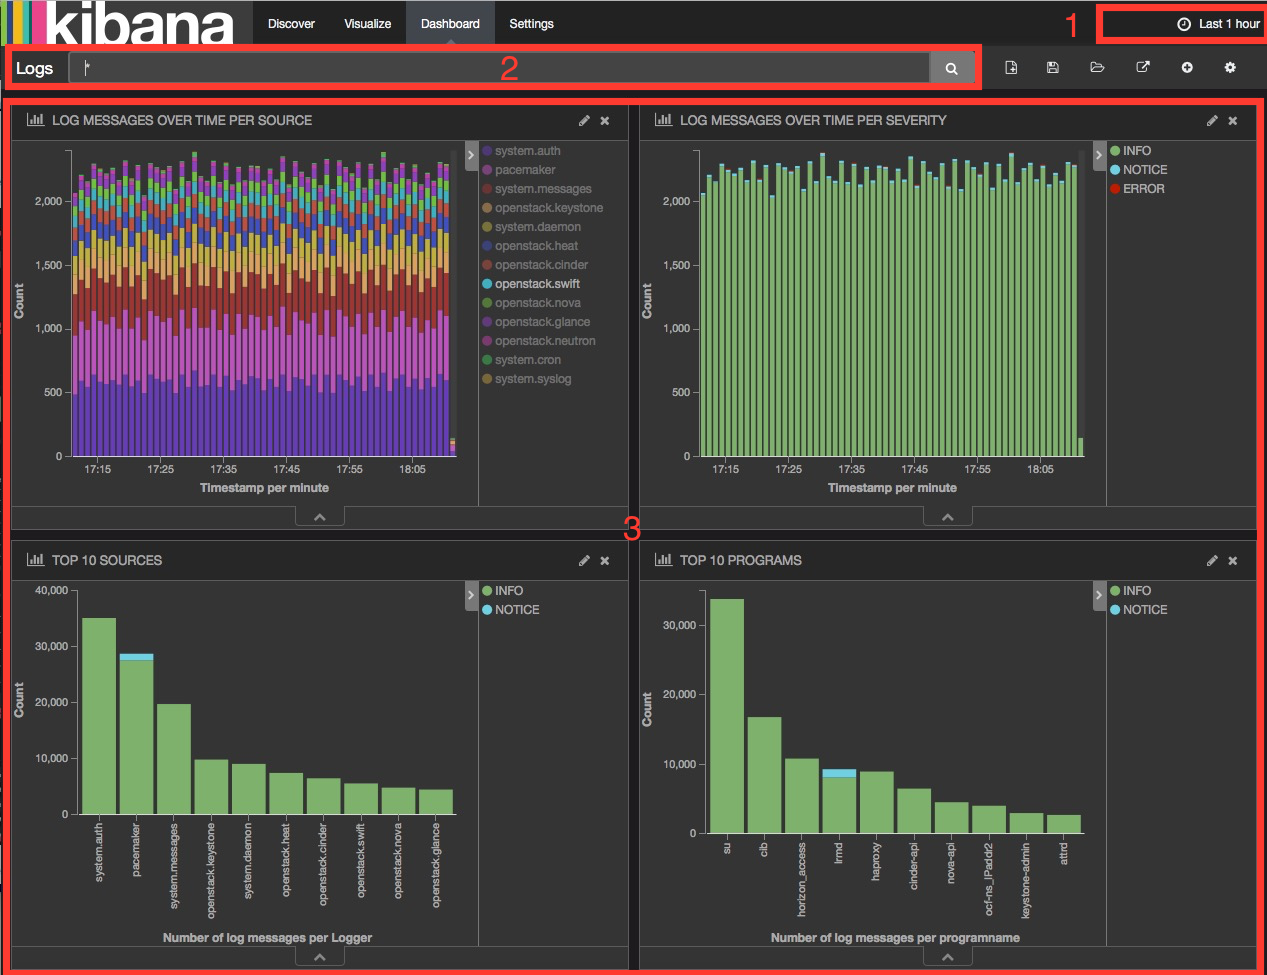
- A time-picker control that lets you choose the time period you want to select and refresh frequency.
- A text box to enter search queries.
- Various logs analytics with six different panels:
- A stack graph showing all the logs per source.
- A stack graph showing all the logs per severity.
- A stack graph showing all logs for top 10 sources.
- A stack graph showing all the logs for top 10 programs.
- A stack graph showing all logs for top 10 hosts.
- A graph showing the number of logs per severity.
- A graph showing the number of logs per role.
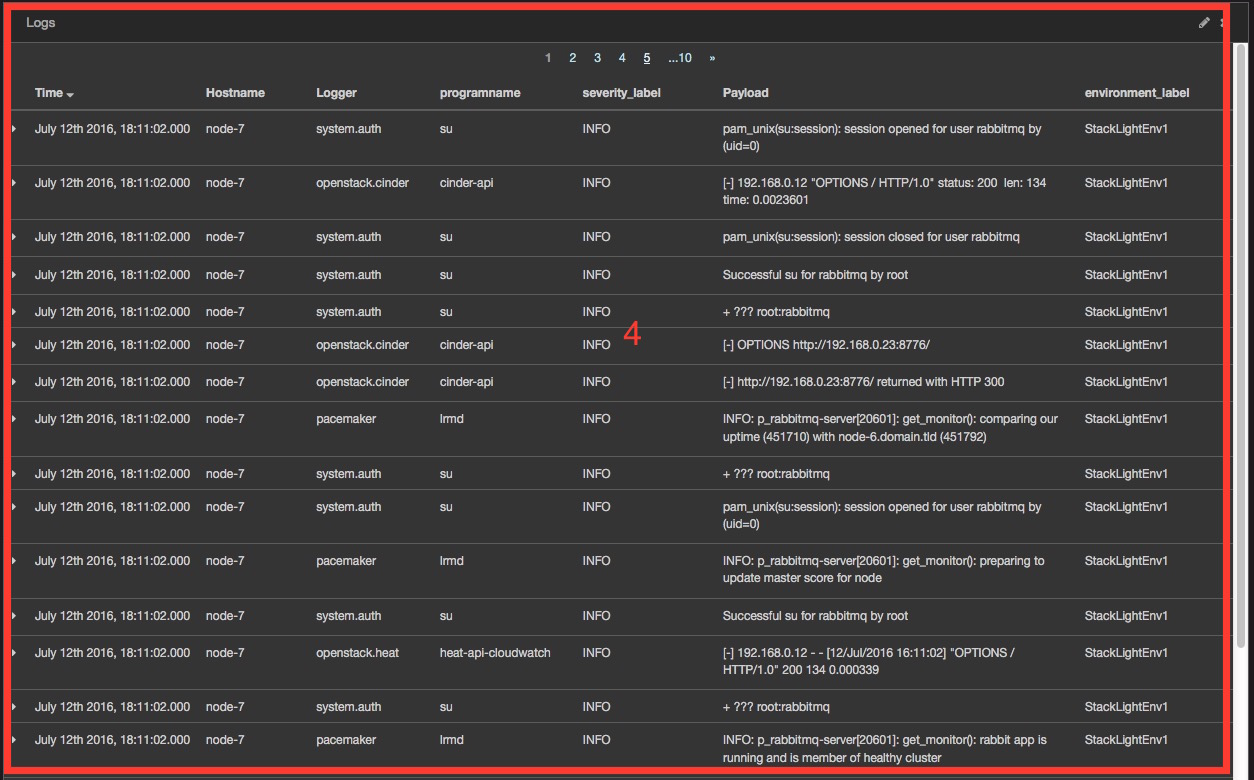
- A table of log messages sorted in reverse chronological order.
Filters and queries
Filters and queries have similar syntax but they are used for different purposes:
- The filters are used to restrict what is displayed in the Dashboard.
- The queries are used for free-text search.
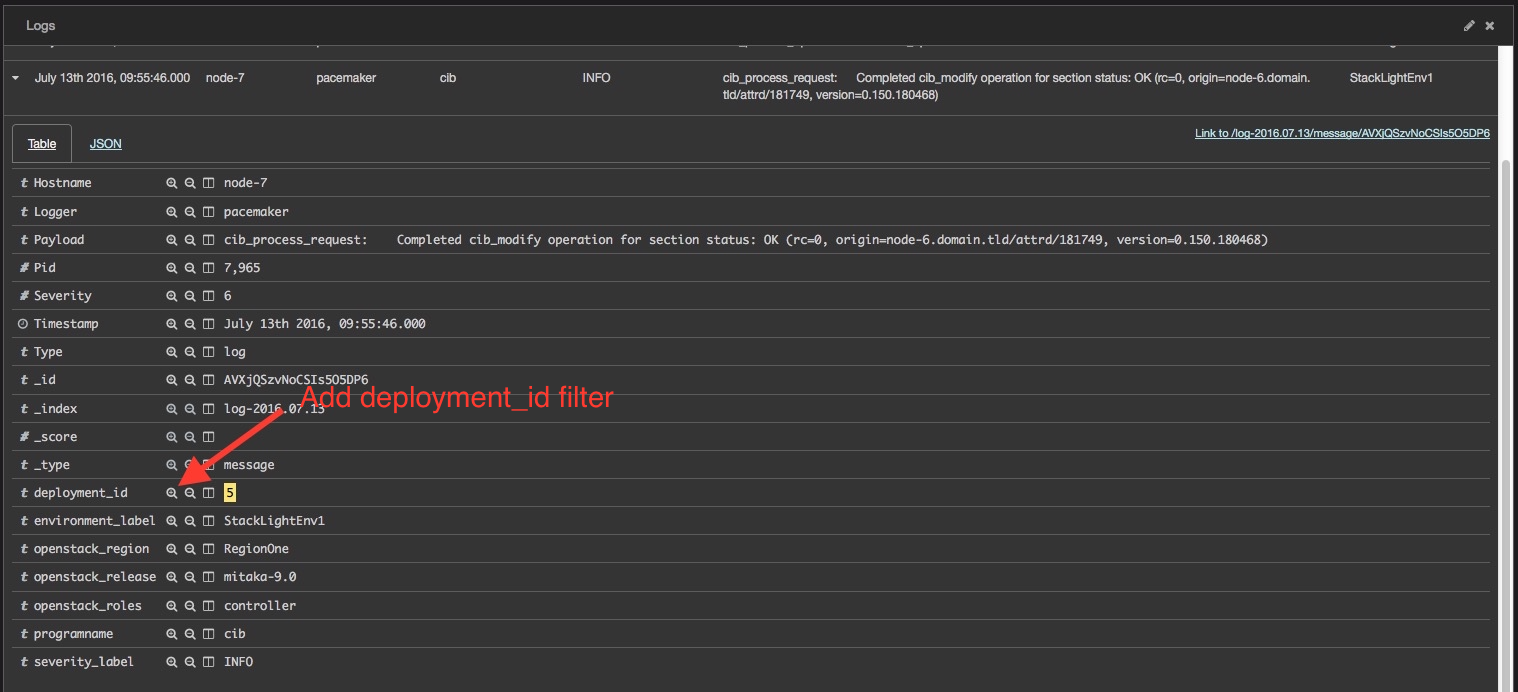
You can combine multiple queries and compare their results. You can also further filter the log messages. For example, to select deployment_id:
Expand a log entry.
Select the deployment_id field by clicking on the magnifying glass icon as shown below:
This will apply a new filter in the Dashboard:

Filtering works for any field that has been indexed for the log entries that are in the Dashboard.
Filters and queries can also use wildcards that can be combined with the
field names like in programname: <name>*.
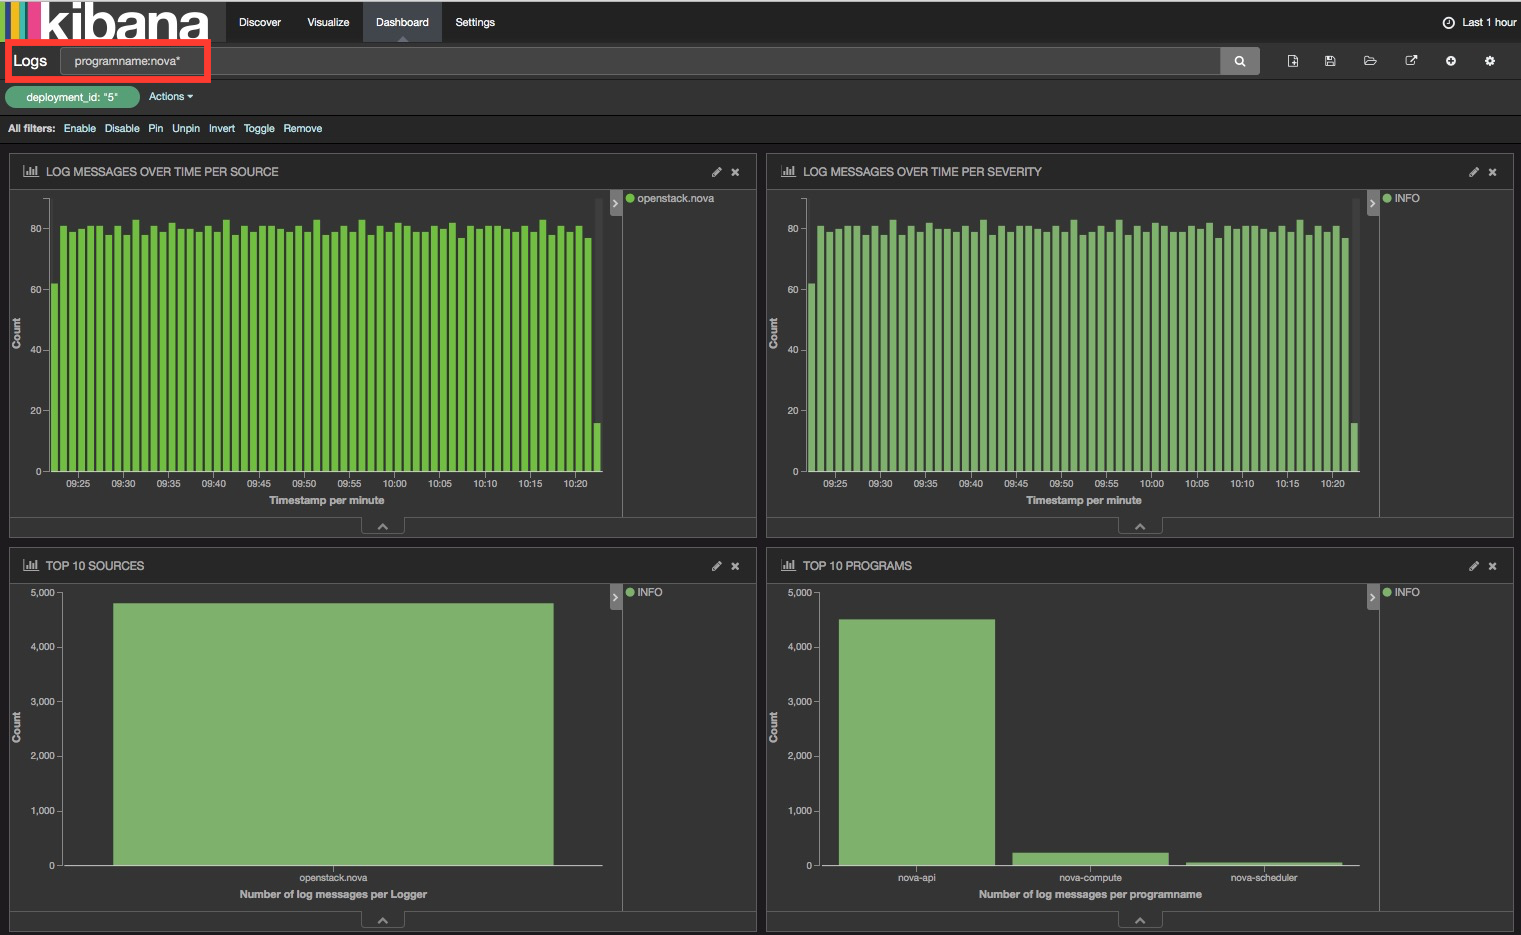
For example, to display only the Nova logs, enter programname:nova* in
the query text box as shown below: