User Guide
Plugin configuration
To configure your plugin, you need to follow these steps:
- Create a new environment with the Fuel web user interface.
- Click on the Settings tab of the Fuel web UI.
- Scroll down the page and select the Elasticsearch-Kibana Plugin in the left column. The Elasticsearch-Kibana Plugin settings screen should appear as shown below.
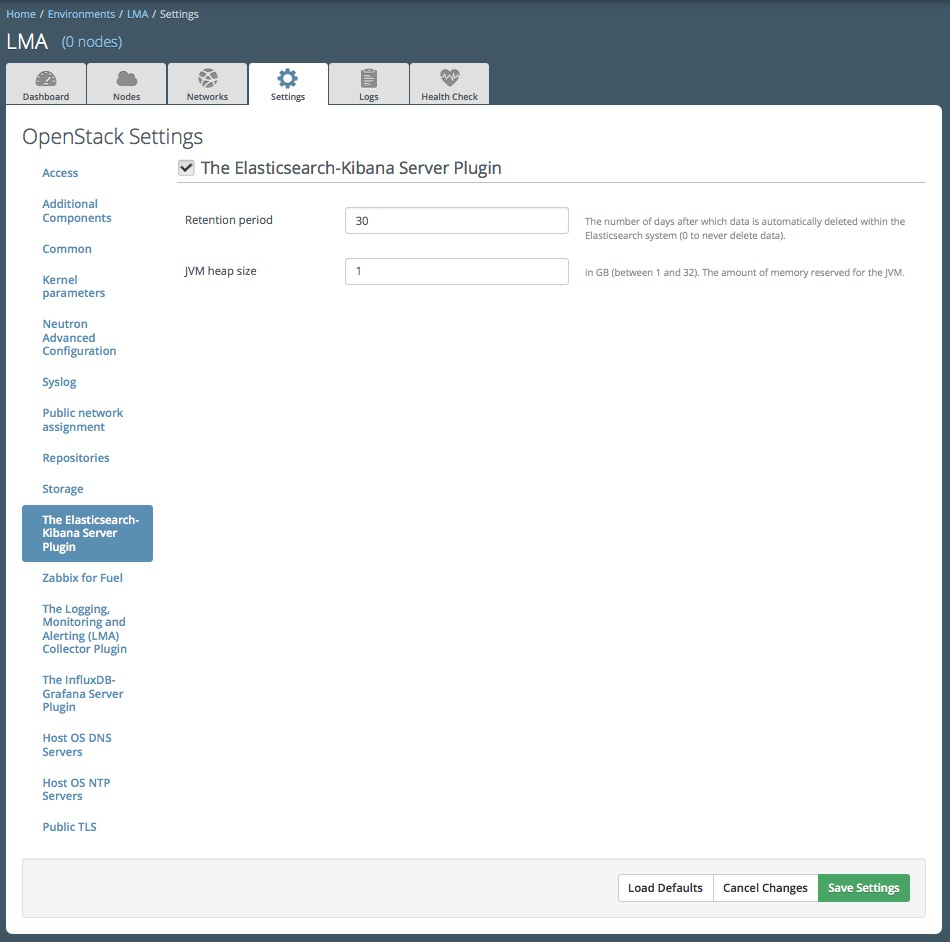
- Select the Elasticsearch-Kibana Plugin checkbox and fill-in the required fields.
- Specify the data retention period in number of days.
- Specify the JVM heap size for Elastisearch. See configuration recommendations below.
Note
By default, 1GB of heap memory is allocated to the Elasticsearch process. This value is too small to run Elasticsearch for anything else than local testing. To run Elasticsearch in production you need to allocate at least 4 GB of memory but it is recommended to allocate 50% of the available memory up to 32 GB maximum.
If you set a value that is greater than the memory size, Elasticsearch won’t start. Keep in mind also to reserve enough memory for the operating system and the other services.
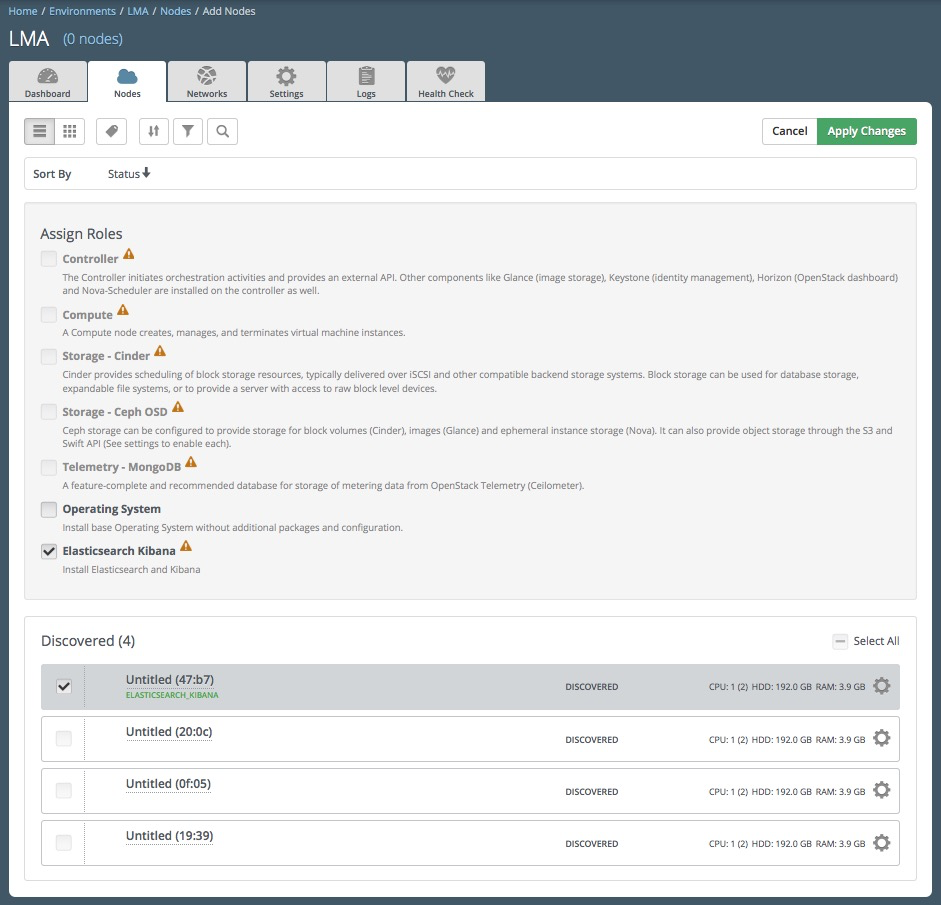
- Assign the Elasticsearch Kibana role to a node as shown in the figure below.
Note
Because of a bug with Fuel 7.0 (see bug #1496328), the UI won’t let you assign the Elasticsearch Kibana role if at least one node is already assigned with one of the built-in roles.
To workaround this problem, you should either remove the already assigned built-in roles or use the Fuel CLI:
$ fuel --env <environment id> node set --node-id <node_id> --role=elasticsearch_kibana
- Adjust the disk configuration if necessary (see the Fuel User Guide for details). By default, the Elasticsearch-Kibana Plugin allocates:
- 20% of the first available disk for the operating system by honoring a range of 15GB minimum and 50GB maximum.
- 10GB for /var/log.
- At least 30 GB for the Elasticsearch database in /opt/es-data.
- Configure your environment as needed.
- Verify the networks on the Networks tab of the Fuel web UI.
- Deploy your changes.
Plugin verification
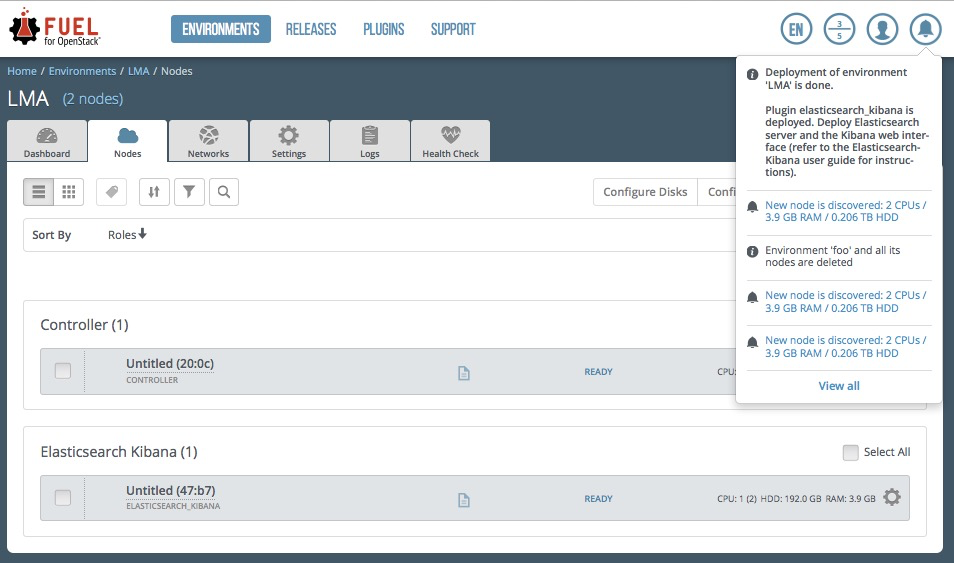
Be aware, that depending on the number of nodes and deployment setup, deploying a Mirantis OpenStack environment can typically take anything from 30 minutes to several hours. But once your deployment is complete, you should see a notification that looks the following:
Elasticsearch
Once your deployment has completed, you should verify that Elasticsearch is installed properly using curl:
curl http://$HOST:9200/
Where HOST is the IP address of the node which runs the Elasticsearch server.
The expected output should look like something like this:
{
  "status" : 200,
  "name" : "node-23-es-01",
  "cluster_name" : "elasticsearch",
  "version" : {
      "number" : "1.4.5",
      "build_hash" : "c88f77ffc81301dfa9dfd81ca2232f09588bd512",
      "build_timestamp" : "2015-04-19T13:05:36Z",
      "build_snapshot" : false,
      "lucene_version" : "4.10.4"
  },
  "tagline" : "You Know, for Search"
}
Note: You can retrieve the IP address where Elasticsearch-Kibana is installed using the fuel command line:
[root@fuel ~]# fuel nodes
id | status   | name | cluster | ip        | ... | roles                | ...
---|----------|----------------|-----------|-----|----------------------|----
14 | ready    | ctrl | 8       | 10.20.0.8 | ... | controller           | ...
13 | ready    | lma  | 8       | 10.20.0.4 | ... | elasticsearch_kibana | ...
Kibana
Kibana is installed with two dashboards. One for the logs and one for the OpenStack notifications.
Each dashboard provides a single pane of glass and search capabilities for all the logs and all the notifications. Note that in the LMA Collector settings, it is possible to tag the logs by environment name so that you can distiguish which logs (and notifications) where created by environment name.
As for Elasticsearch, you should verify that Kibana is properly installed through checking its URL:
http://$HOST:80/
Where HOST is the IP address of the node where Kibana has been installed. By default, you will be redirected to the Logs Dashboard.
Dashboards management
The Elasticsearch-Kibana plugin comes with two pre-configured dashboards:
- The Logs Dashboard that is the Kibana Home Dashboard for viewing the log messages.
- The Notifications Dashboard for viewing the OpenStack notifications if you enabled this option in the LMA Collector settings.
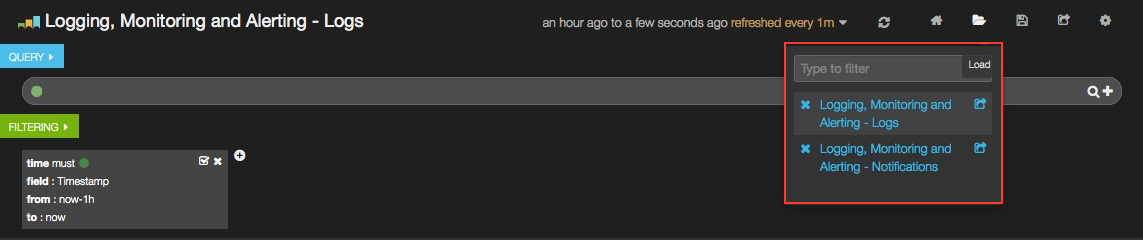
You can switch from one dashboard to another by clicking on the top-right Load icon in the toolbar to select the requested dashboard from the list, as shown below.
Pointing your browser to the URL http://10.20.0.4:80/ you should see the Logs Dashboard:
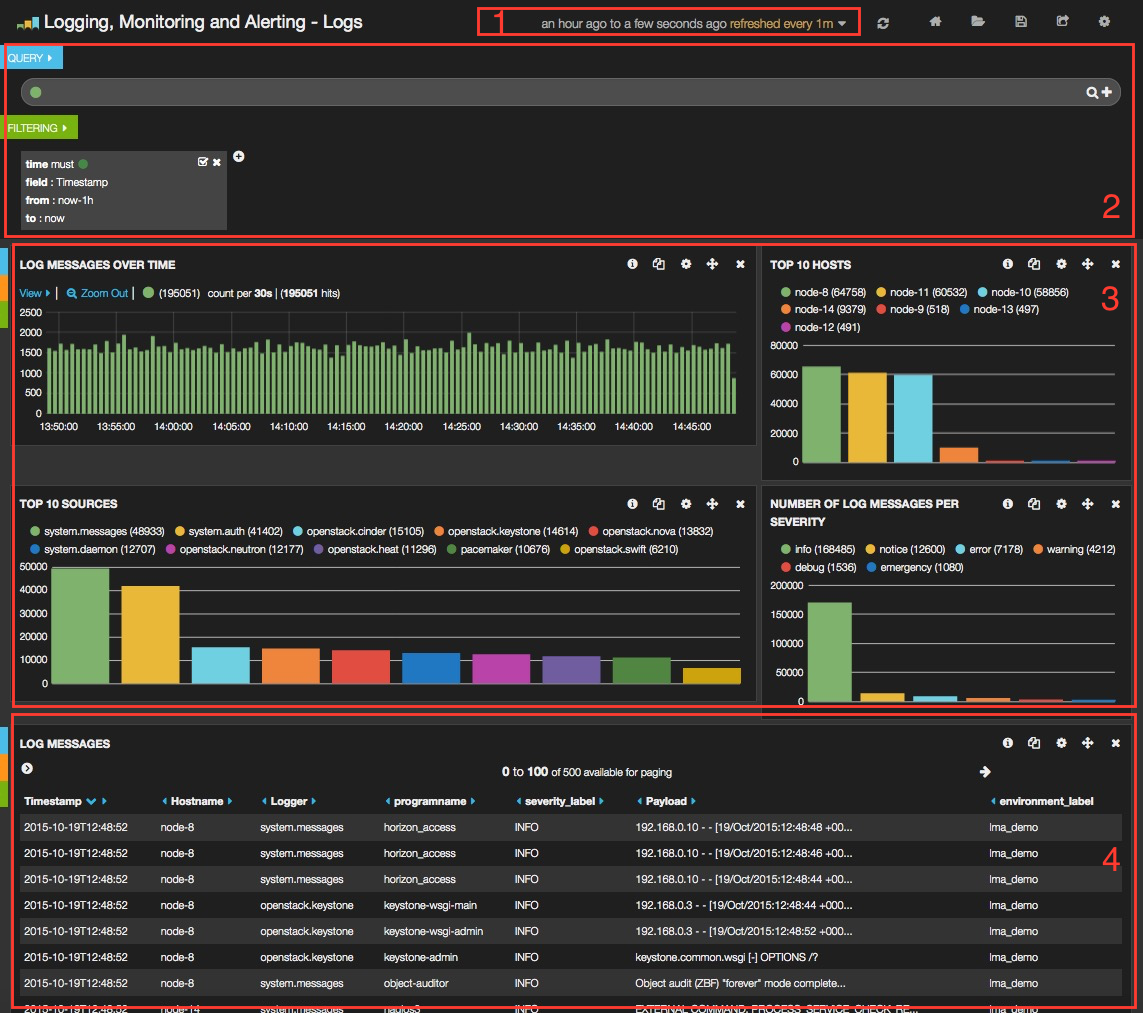
As you can see, the Kibana dashboard for logs is divided into four main sections:
- A time-picker control that lets you choose the time period you want to select and refresh frequency.
- A query and filter section where all the filters are displayed.
- A log analytics row which contains four panels to visualize:
- The number of log messages for the chosen time period.
- The top 10 hosts filter.
- The top 10 log sources.
- The number of log messages grouped by severity.
- A table of log messages sorted in reverse chronological order.
Filters and queries
Filters and queries have similar syntax but they are used for different purposes.
- The filters are used to restrict what is displayed in the dashboard.
- The queries are used for free-text search.
You can also combine multiple queries and compare their results. To further filter the log messages based, for example, on the deployment_id, you need to expand a log entry and then select the deployment_id field by clicking on the magnifying glass icon as shown below.
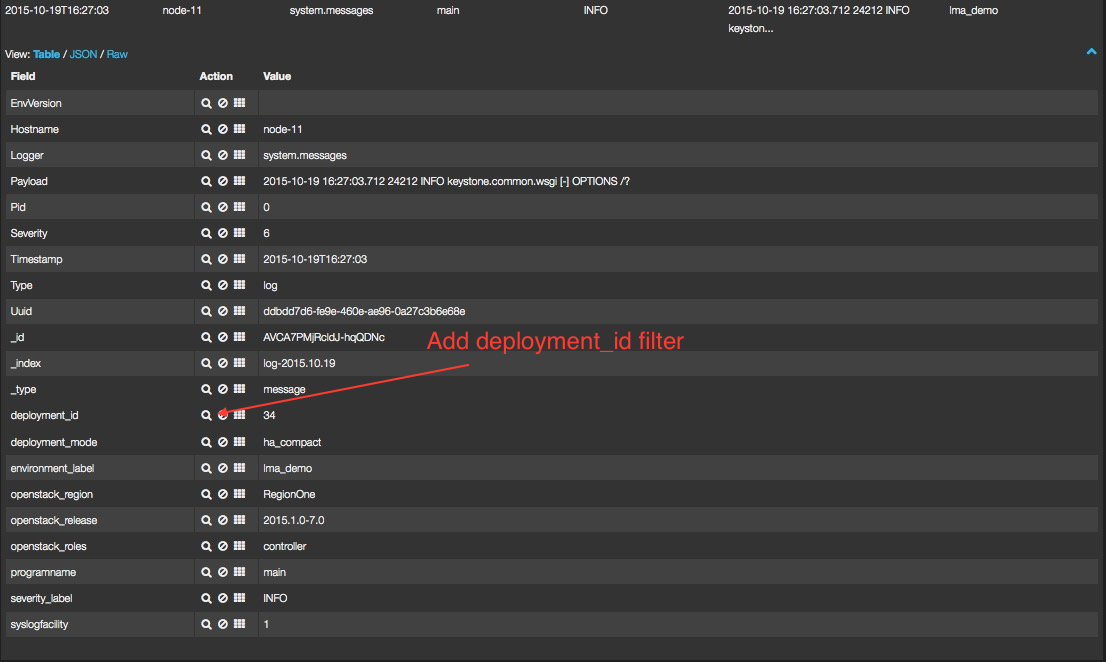
This will apply a new filter in the dashboard.
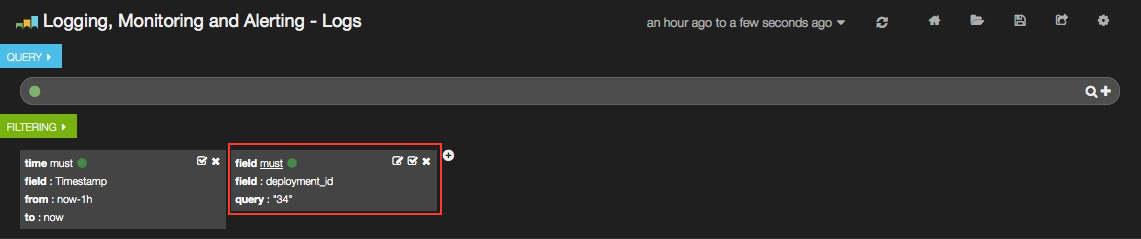
Filtering will work for any field that has been indexed for the log entries that are displayed in the dashboard.
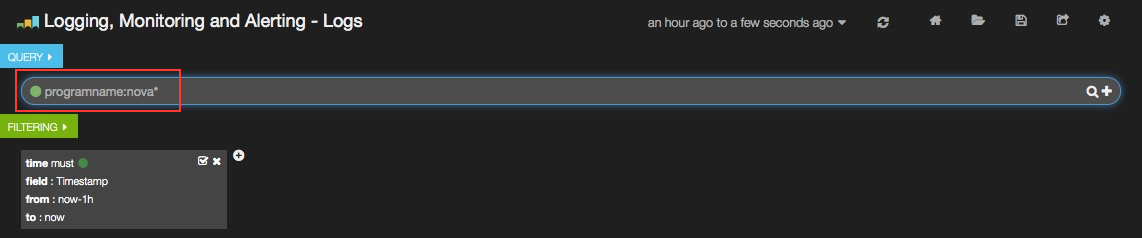
Filters and queries can also use wildcards wich can be conbined with field names like in:
programname: <name>*
For example, to display only the Nova logs you could enter:
programname:nova*
in the query textbox like shown below.
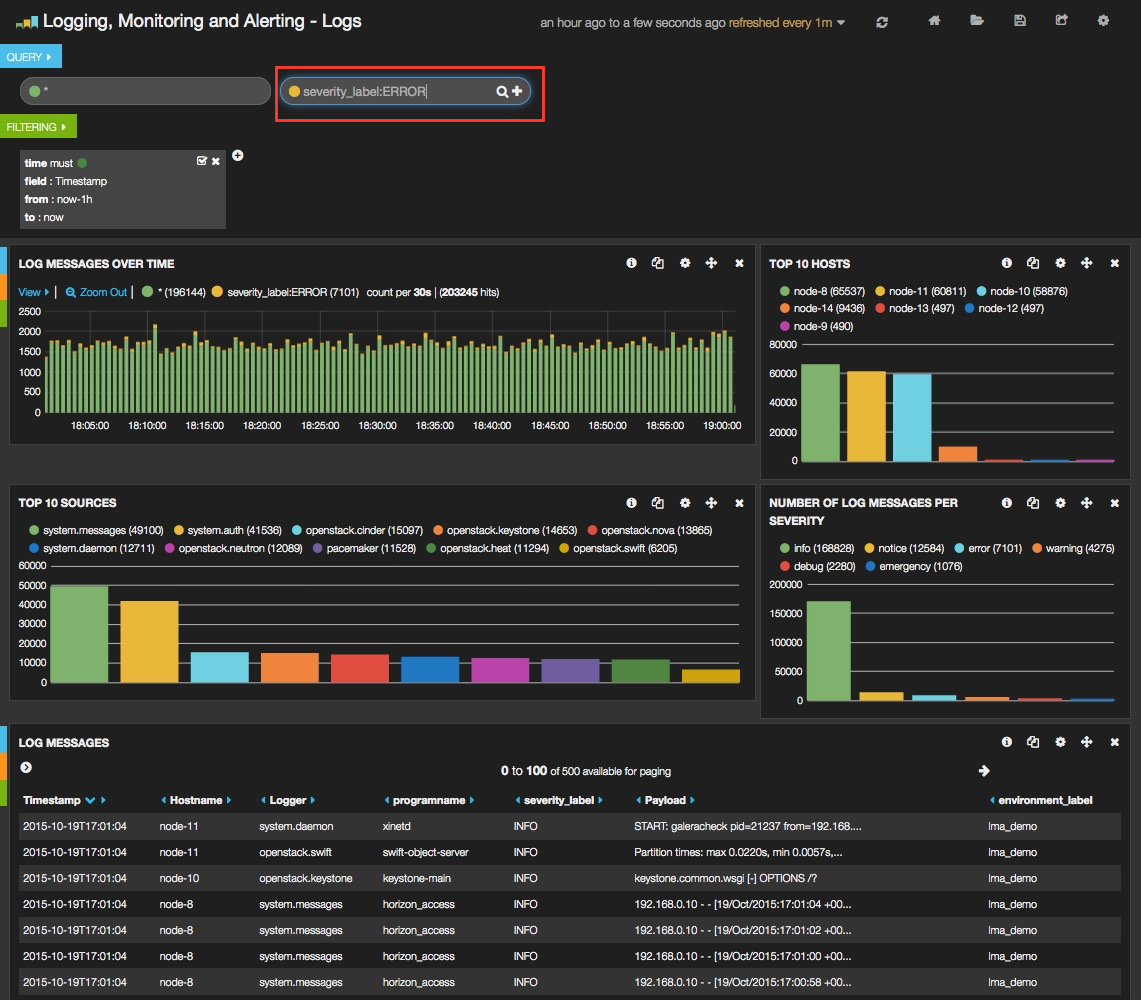
You can also specify multiple queries to compare different data sets.
To add a new query, click on the + sign at the right-end of the query textbox and enter a new search query.
The resulting filtering should appear comparing those logs that are in ERROR versus those that are not as shown below.
Troubleshooting
If you get no data in the Kibana dashboards, follow these troubleshoot tips.
First, check that the LMA Collector is running properly by following the troubleshooting instructions of the LMA Collector Fuel Plugin User Guide.
Check if the nodes are able to connect to the Elasticsearch server on port 9200.
Check that the Elasticsearch server is up and running:
# On both CentOS and Ubuntu
[root@node-13 ~]# /etc/init.d/elasticsearch-es-01 status
If Elasticsearch is down, start it:
# On both CentOS and Ubuntu
[root@node-13 ~]# /etc/init.d/elasticsearch-es-01 start
Check if nginx is up and running:
# On both CentOS and Ubuntu
[root@node-13 ~]# /etc/init.d/nginx status
If nginx is down, start it:
# On both CentOS and Ubuntu
[root@node-13 ~]# /etc/init.d/nginx start
Look for errors in the Elasticsearch log files (located at /var/log/elasticsearch/es-01/).
Look for errors in the nginx log files (located at /var/log/nginx/).